All guides
GuidesYour books
Reports
Open a ready-made report, change what it measures and how it is grouped, add filters, compare with the period before, save it and download it.
5 minute read
Ready-made reports
Under Insights, Reports has two lists: Ready-made and Yours.
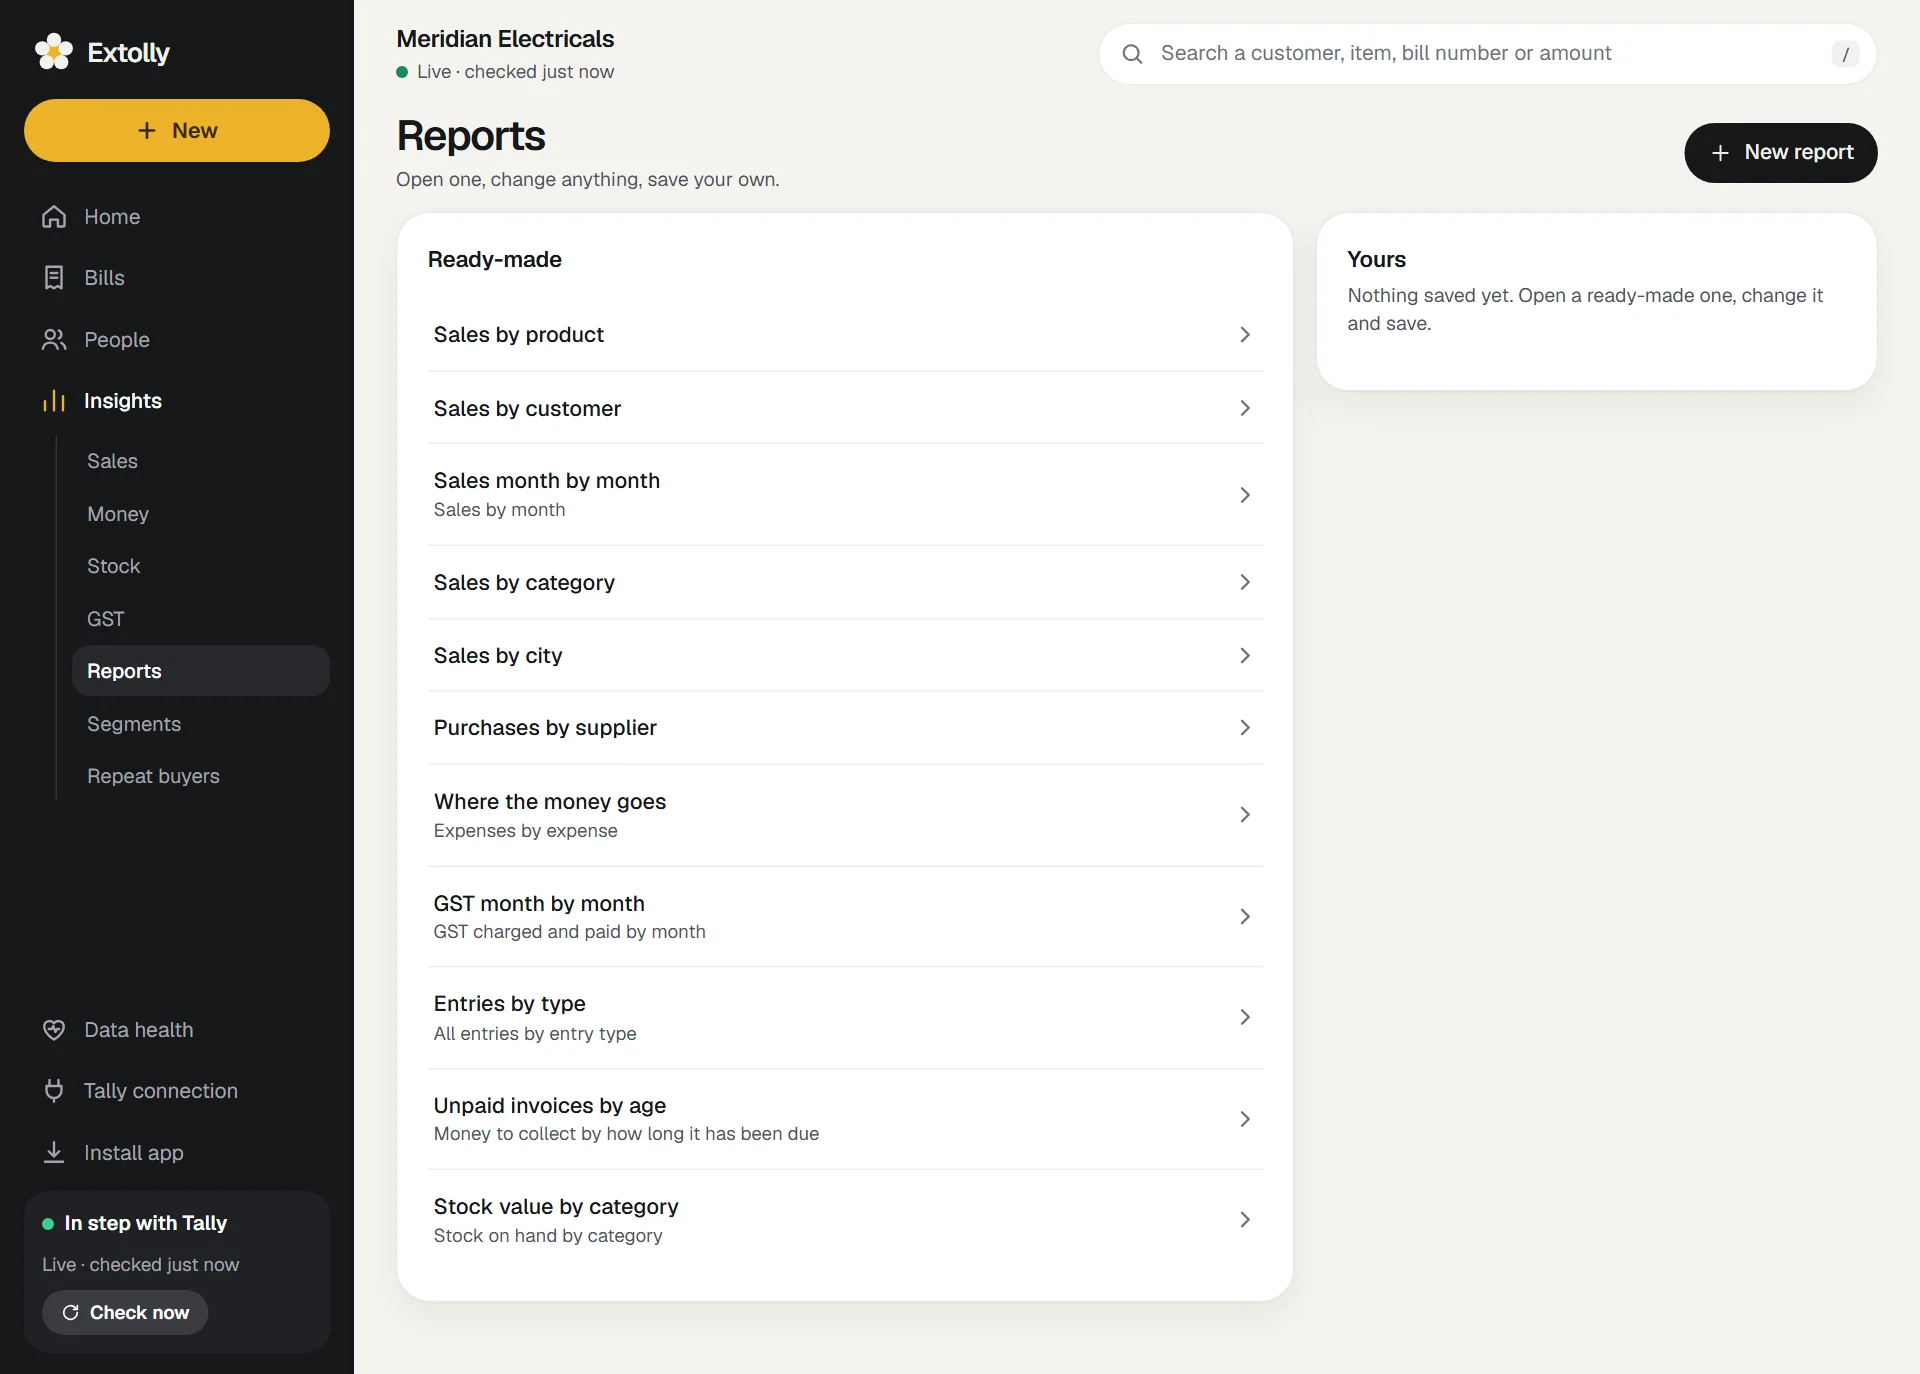
| Ready-made report | Shows |
|---|---|
| Sales by product | Net sales, gross profit, margin and quantity for each product |
| Sales by customer | Net sales, invoices and gross profit for each customer |
| Sales month by month | Net sales, gross profit and invoices by month |
| Sales by category | Net sales, margin and quantity by stock group |
| Sales by city | Net sales, customers and invoices by city |
| Purchases by supplier | Purchases and bills for each supplier |
| Where the money goes | Expenses by ledger |
| GST month by month | Charged on sales, paid on purchases, net to pay |
| Entries by type | How many entries of each type, their amount and average |
| Unpaid invoices by age | Unpaid amounts by how long they have been due |
| Stock value by category | Stock value and items by stock group |
Press one to open it. A ready-made report is never changed: when you alter one and save, the copy goes under Yours.
Read a report
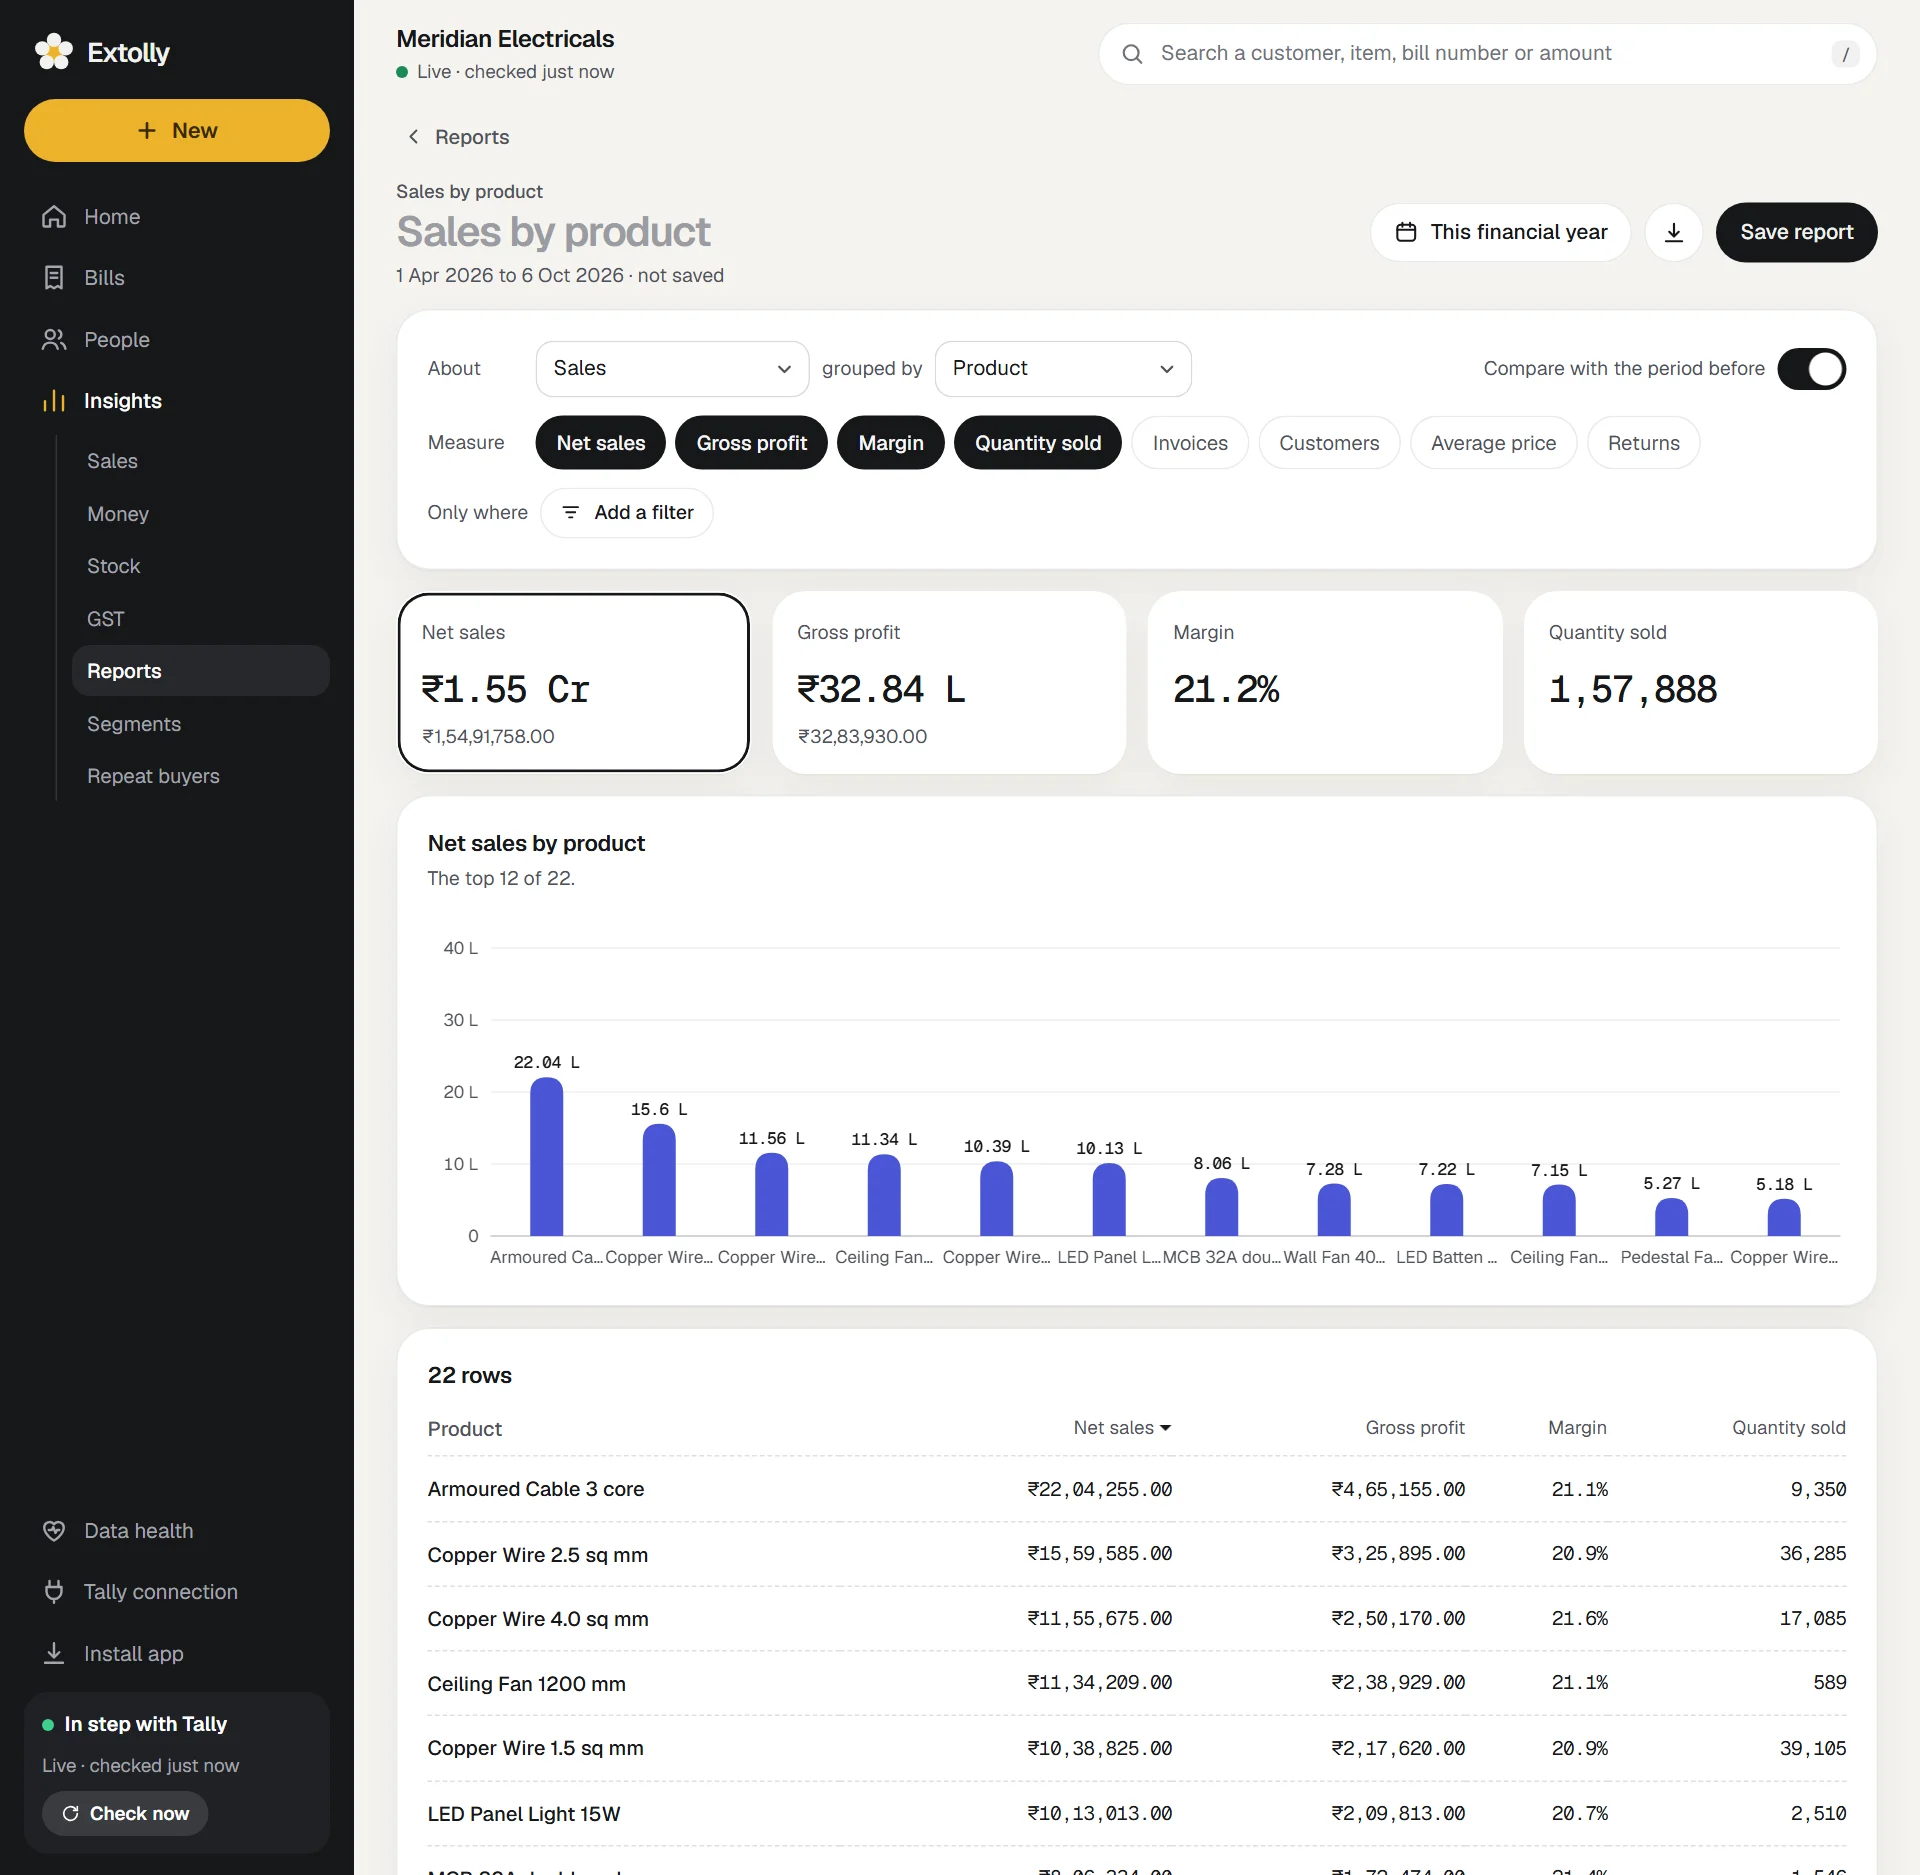
- A figure card for each measure, with its total. Press a card to put that measure in the chart.
- A chart of the measure by the grouping. Grouped by month, week or day it shows the latest 60. Otherwise it shows the top 12.
- A table with every row and a Total. Press a column heading to sort by it, and again to reverse.
- In a report grouped by Product or Customer, press a row for that product's or customer's detail.
Build your own
Press New report, or open any report and change it. The builder has three rows.
1. About, grouped by
Choose what the report is About, then how it is grouped by.
| About | Group by | Measures |
|---|---|---|
| Sales | Product, Category, Customer, City, State, Customer group, Godown, Entry type, Month, Week, Day, Day of the week | Net sales, Gross profit, Margin, Quantity sold, Invoices, Customers, Average price, Returns |
| Purchases | Product, Category, Supplier, City, State, Supplier group, Godown, Month, Week, Day, Day of the week | Purchases, Quantity bought, Bills, Average cost |
| Expenses | Expense, Group, Month, Week, Day, Day of the week | Amount, Entries |
| All entries | Entry type, Party, City, State, Month, Week, Day, Day of the week | Entries, Amount, Average, Largest, Parties |
| GST charged and paid | Tax head, Tax ledger, Month, Week, Day, Day of the week | Charged on sales, Paid on purchases, Net to pay |
| Money to collect | Customer, City, How long it has been due, Month billed | Unpaid, Invoices, Oldest in days, Past due |
| Stock on hand | Product, Category | Stock value, Quantity, Items |
Nothing (totals only) gives the totals with no rows. Money to collect and Stock on hand are always as of today, so they have no period.
2. Measure
Press a chip to turn a measure on or off. A report shows between one and six.
3. Only where
Filters narrow the report. Press Add a filter, choose a field, choose is, is not or contains, choose a value, and press Add filter.
- Add up to 12. All of them must hold.
- Sales and Money to collect reports can also be narrowed to Customer is in segment, and Stock on hand to Product is in segment. See Segments.
Compare with the period before
Switch on Compare with the period before. Each figure card gains a change tag and the earlier figure, the chart shows both periods side by side, and the table gains Change columns.
The earlier period must lie wholly inside your books, or nothing is compared. A row that did not exist before reads new. A report grouped by month, week or day compares the totals only.
Save
- Press the title at the top and type a name.
- Press Save report.
It appears under Yours. A saved report remembers its period by name, so "Last 90 days" moves with the calendar. Only a custom range is kept as fixed dates.
The ... button on a saved report offers Save a copy and Delete this report.
Download as a spreadsheet
Press the download button at the top of a report. It saves a CSV file named after the report, with every row (up to 50,000) and a total. CSV files open in Excel and every other spreadsheet program.
The screen shows the first 200 rows of a long report. The download always has all of them.
Start a report from elsewhere
New, then Report opens the builder from anywhere. Reports also appear in search: type part of a report's name.
Still stuck? Write to support@extolly.com and say which step you are on.